
Page 1 - Overbuilt Assessing the Diminishing Returns to Building in China
P. 1
Distributed by the American Chamber of Commerce in South China
SCCEI CHINA BRIEFS
Updated July 1, 2025
Overbuilt? Assessing the Diminishing Returns
to Building in China
Kenneth Rogoff and Yuanchen Yang (2024). Rethinking China’s Growth. Economic Policy.
China’s building boom has reshaped the physical and economic landscape of the country, lifting hundreds of mil-
lions out of poverty and transforming China into a global powerhouse. But the crisis in China’s property sector has
exposed diminishing returns to building. Where has the country overbuilt most and what are the implications?
The data. The researchers build a detailed city-level dataset (2000–2022) to study how real estate and infrastruc-
ture investment have influenced China’s growth. They estimate housing stock and floor space using census and
statistical yearbooks, incorporate investment and GDP data from the CEIC database, and track debt levels using
bond data from the WIND database and other Chinese sources. They also include infrastructure data (roads, rail,
sewage) to assess the geographic distribution of construction, particularly in tier 3, 4 and 5 cities (collectively
called “tier 3 cities”). To compare internationally, they use data from China and OECD countries to assess the share
of GDP that accounted for real estate and infrastructure across countries. They use a shift-share method to isolate
the impact of real estate investment on growth and debt.
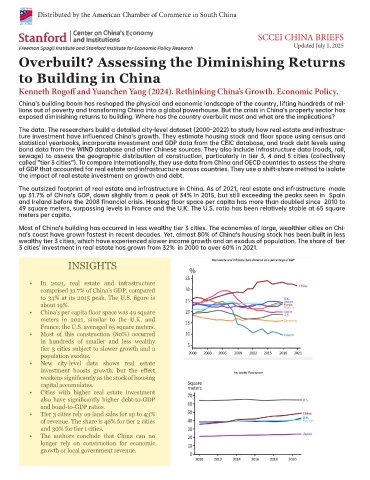
The outsized footprint of real estate and infrastructure in China. As of 2021, real estate and infrastructure made
up 31.7% of China’s GDP, down slightly from a peak of 34% in 2015, but still exceeding the peaks seen in Spain
and Ireland before the 2008 financial crisis. Housing floor space per capita has more than doubled since 2010 to
49 square meters, surpassing levels in France and the U.K. The U.S. ratio has been relatively stable at 65 square
meters per capita.
Most of China’s building has occurred in less wealthy tier 3 cities. The economies of large, wealthier cities on Chi-
na’s coast have grown fastest in recent decades. Yet, almost 80% of China’s housing stock has been built in less
wealthy tier 3 cities, which have experienced slower income growth and an exodus of population. The share of tier
3 cities’ investment in real estate has grown from 32% in 2000 to over 60% in 2021.
INSIGHTS
• In 2021, real estate and infrastructure
comprised 31.7% of China’s GDP, compared
to 34% at its 2015 peak. The U.S. figure is
about 19%.
• China’s per capita floor space was 49 square
meters in 2021, similar to the U.K. and
France; the U.S. averaged 65 square meters.
• Most of this construction (80%) occurred
in hundreds of smaller and less wealthy
tier 3 cities subject to slower growth and a
population exodus.
• New city-level data shows real estate
investment boosts growth, but the effect
weakens significantly as the stock of housing
capital accumulates.
• Cities with higher real estate investment
also have significantly higher debt-to-GDP
and bond-to-GDP ratios.
• Tier 3 cities rely on land sales for up to 43%
of revenue. The share is 46% for tier 2 cities
and 30% for tier 1 cities.
• The authors conclude that China can no
longer rely on construction for economic
growth or local government revenue.