Page 28 - 2017 Special Report
P. 28
To North American market 8.4%
To South American market 4.7%
To other markets than the above 6.5%
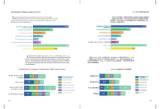
Destinations of Reinvestment in 2016 No shift in reinvestment 2016幓å???2čµ?9.9??% ???
Not applicable
20%
For the first time we have noticed a shift of reinvestment to other markets. ??0 52016幓ę?1??0 ļ¼???¶ę?15ēŗ???????20č®æä?äø?”Ø2ē¤?5ä»?»¬ę²”ę?3č½?0ē§»ę?
Although 30% of respondents reported no shift, a majority responded that in 2016 čµ???¶ä?åø??ļ¼?¤§?Øå????č®æä?äø??č”Øē¤ŗä»?»¬å°??čµ?½¬ē§»å?
they did shift some reinvestments to other markets with other ex-China Asian markets ?¶ä?åø??ļ¼??äø??å¤?????ļ¼??????°å?å¤??ļ¼?ø?½å?ä»???ŗå?ļ¼??
soaking up much of the shifted funds. äø??å¤??ļ¼??ę“²å?ä»???ŗć??
To other markets in China 16.4% 29.4% Wholly foreign-owned 21% 13% 9% 33% To other markets in China
(other than South China) company
To other Asian markets 20% 29.9% (other than South China)
To European market 10.3%
8.4% 15 20 25 30 To other Asian markets
To North American market 4.7%
To South American market 6.5% Joint venture 40% 11% 8% 17% To European markets
To other markets than the above
5 10 Representative o ce 20% 26% 13% 20% 6% 46% To North American markets
No shift in reinvestment of foreign company
Not applicable Wholly foreign-owned To other mTaorkSetos uintChhiAnamerican market
0 company 21% 13% 9% 33%
(other than South China)
Local Chinese company 31% 17% 11% 12% 13% 20%
Joint venture 40% 11% 8% 17% To other ATsioanomtharekertms arkets than abov
To EuropeNanomtasrhkeitfst of investment
0 30 60 90 120 150
Representative o ce To North American markets
of foreign company 20% 26% 13% 20% 6% 46% To South American markets
To other markets than above
In 2016, 13.3% of wholly foreign-owned enterprises, 11.4% of joint ventures, and ??2016Lå¹?cļ¼?l C??iå½?eäø?se??o??p??n?? č®æč??31ļ¼?% ?¶äø1??7%??1113%.132%% ??13å¤?%čµ?2??0%čµ??äø???11.4% Not shift of investment
26.67% of representatives offices of foreign enterprises, representing a substantial ???čµ??äø??26.67%???0čµ??äø??3äŗ?0 å¤??č”?6ē¤?0 å·²å??Øå?90???čµ?1č½?2ē§?0 ?°ä?äø?150
number of respondents, reported that they had shifted some reinvestments to other ?½å????ä»??ę“²å?家ć????¶ļ?17.6%??øčµ??äø?”Øē¤ŗä?ä»?ŗ¦å°??äŗ?µ·å¤?????锹ē?č½?
Asian, ex-China destinations. Among the Chinese company respondents, a significant ē§»å?äŗ??ä»??ę“²å?家ć??
percentage (17.6%) said that they had moved some reinvestments overseas to other
Asian destinations.
Different Forms of Companies and Their Shift of Reinvestment in 2016 2016幓ä?äø?±»??????čµ?½¬ē§?
Wholly foreignco-Womhwoplnlyaenfodyreign-2o1w%ned 13% 9% 33% To other markets in China 55
company 21% 13% 9% 33% (other than South China)
Joint ventureJoint vent4u0re% 40%11% 81%1% 8% 171%7% To other markets in China
ReopfrfeosreenigtanticvoemRoeoppfrafeocsnreeeynigtanticv2oe0mo%pacney 2206%% 26%13% 13%20%20% 66%% 464%6% (other than SouTthoChointah) er Asian markets
Local Chinese company 31% 17% 11% 12% 13% 20% 150 To other Asian markets
Local Chinese company 31% 0 17%3011% 126%0 13% 9020% 120 To European mToarkEeutsropean markets
0 30 60 90 120 To North AmeTroicaNn omratrhketAsmerican markets
To South AmeTroicaSnomuatrhketAs merican markets
To other markets than above
Not shift of inTvoestomtehnet r markets than above
Not shift of investment
150
54
To South American market 4.7%
To other markets than the above 6.5%
Destinations of Reinvestment in 2016 No shift in reinvestment 2016幓å???2čµ?9.9??% ???
Not applicable
20%
For the first time we have noticed a shift of reinvestment to other markets. ??0 52016幓ę?1??0 ļ¼???¶ę?15ēŗ???????20č®æä?äø?”Ø2ē¤?5ä»?»¬ę²”ę?3č½?0ē§»ę?
Although 30% of respondents reported no shift, a majority responded that in 2016 čµ???¶ä?åø??ļ¼?¤§?Øå????č®æä?äø??č”Øē¤ŗä»?»¬å°??čµ?½¬ē§»å?
they did shift some reinvestments to other markets with other ex-China Asian markets ?¶ä?åø??ļ¼??äø??å¤?????ļ¼??????°å?å¤??ļ¼?ø?½å?ä»???ŗå?ļ¼??
soaking up much of the shifted funds. äø??å¤??ļ¼??ę“²å?ä»???ŗć??
To other markets in China 16.4% 29.4% Wholly foreign-owned 21% 13% 9% 33% To other markets in China
(other than South China) company
To other Asian markets 20% 29.9% (other than South China)
To European market 10.3%
8.4% 15 20 25 30 To other Asian markets
To North American market 4.7%
To South American market 6.5% Joint venture 40% 11% 8% 17% To European markets
To other markets than the above
5 10 Representative o ce 20% 26% 13% 20% 6% 46% To North American markets
No shift in reinvestment of foreign company
Not applicable Wholly foreign-owned To other mTaorkSetos uintChhiAnamerican market
0 company 21% 13% 9% 33%
(other than South China)
Local Chinese company 31% 17% 11% 12% 13% 20%
Joint venture 40% 11% 8% 17% To other ATsioanomtharekertms arkets than abov
To EuropeNanomtasrhkeitfst of investment
0 30 60 90 120 150
Representative o ce To North American markets
of foreign company 20% 26% 13% 20% 6% 46% To South American markets
To other markets than above
In 2016, 13.3% of wholly foreign-owned enterprises, 11.4% of joint ventures, and ??2016Lå¹?cļ¼?l C??iå½?eäø?se??o??p??n?? č®æč??31ļ¼?% ?¶äø1??7%??1113%.132%% ??13å¤?%čµ?2??0%čµ??äø???11.4% Not shift of investment
26.67% of representatives offices of foreign enterprises, representing a substantial ???čµ??äø??26.67%???0čµ??äø??3äŗ?0 å¤??č”?6ē¤?0 å·²å??Øå?90???čµ?1č½?2ē§?0 ?°ä?äø?150
number of respondents, reported that they had shifted some reinvestments to other ?½å????ä»??ę“²å?家ć????¶ļ?17.6%??øčµ??äø?”Øē¤ŗä?ä»?ŗ¦å°??äŗ?µ·å¤?????锹ē?č½?
Asian, ex-China destinations. Among the Chinese company respondents, a significant ē§»å?äŗ??ä»??ę“²å?家ć??
percentage (17.6%) said that they had moved some reinvestments overseas to other
Asian destinations.
Different Forms of Companies and Their Shift of Reinvestment in 2016 2016幓ä?äø?±»??????čµ?½¬ē§?
Wholly foreignco-Womhwoplnlyaenfodyreign-2o1w%ned 13% 9% 33% To other markets in China 55
company 21% 13% 9% 33% (other than South China)
Joint ventureJoint vent4u0re% 40%11% 81%1% 8% 171%7% To other markets in China
ReopfrfeosreenigtanticvoemRoeoppfrafeocsnreeeynigtanticv2oe0mo%pacney 2206%% 26%13% 13%20%20% 66%% 464%6% (other than SouTthoChointah) er Asian markets
Local Chinese company 31% 17% 11% 12% 13% 20% 150 To other Asian markets
Local Chinese company 31% 0 17%3011% 126%0 13% 9020% 120 To European mToarkEeutsropean markets
0 30 60 90 120 To North AmeTroicaNn omratrhketAsmerican markets
To South AmeTroicaSnomuatrhketAs merican markets
To other markets than above
Not shift of inTvoestomtehnet r markets than above
Not shift of investment
150
54