Page 412 - 2017 White Paper
P. 412
7 White Paper on the Business Environment in China
Budgeted Reinvestment in China
To accommodate fluctuating sample sizes, for the past six years we have reported
reinvestment figures normalized to 100 companies as a primary year-on-year
comparison. This figure is calculated as the products of the mean of each category range
and the percentage of total participants indicating that category, except in the case of
the largest (US$250 million or more) category, for which the minimum value is used.
What is noticeable is that we have witnessed a 4.12% decline in 2017 one-year
reinvestment budgets compared with the same period last year, suggesting that
confidence in investing in China for the coming year is not that high.
Normalized reinvestment figures Estimated reinvestment volumes
(Response distribution applied to 100 companies (Normalized, scaled by a factor representing
by percentage share) chamber membership)
Projected 2017: US$ 2,829,650,000 (-4.12%) Estimated 2017: US$ 12,568,733,177 (-4.12%)
Projected 2016: US$ 3,296,485,000 (+8.79%) Estimated 2016: US$ 13,087,053,000 (+8.79%)
Projected 2015: US$ 3,030,100,000 (-9.3%) Estimated 2015: US$ 12,029,504,000 (-9.03%)
Projected 2014: US$ 3,343,500,000 (+30.10%) Estimated 2014: US$ 13,273,703,000 (+30.10%)
Projected 2013: US$ 2,569,950,000 (+1.9%) Estimated 2013: US$ 10,202,708,000 (+1.9%)
2017 2013
2016 2015 2014 +1.9%
+30.10%
-9.03%
+8.79%
-4.12%
412
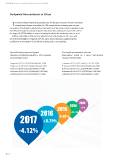