
Page 70 - AmCham South China 2026 Special Report on the State of Business in South China
P. 70
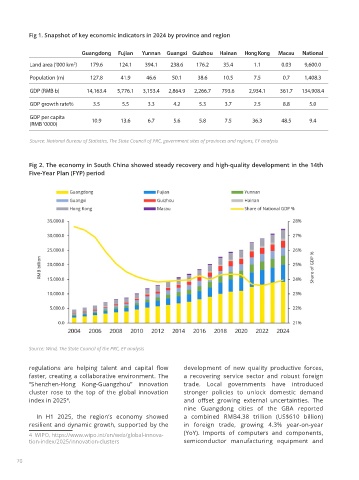
Fig 1. Snapshot of key economic indicators in 2024 by province and region
Guangdong Fujian Yunnan Guangxi Guizhou Hainan Hong Kong Macau National
Land area (ˇ®000 km ) 179.6 124.1 394.1 238.6 176.2 35.4 1.1 0.03 9,600.0
2
Population (m) 127.8 41.9 46.6 50.1 38.6 10.5 7.5 0.7 1,408.3
GDP (RMB b) 14,163.4 5,776.1 3,153.4 2,864.9 2,266.7 793.6 2,934.1 361.7 134,908.4
GDP growth rate% 3.5 5.5 3.3 4.2 5.3 3.7 2.5 8.8 5.0
GDP per capita 10.9 13.6 6.7 5.6 5.8 7.5 36.3 48.5 9.4
(RMB ˇŻ0000)
Source: National Bureau of Statistics, The State Council of PRC, government sites of provinces and regions, EY analysis
Fig 2. The economy in South China showed steady recovery and high-quality development in the 14th
Five-Year Plan (FYP) period
Source: Wind, The State Council of the PRC, EY analysis
regulations are helping talent and capital flow development of new quality productive forces,
faster, creating a collaborative environment. The a recovering service sector and robust foreign
ˇ°Shenzhen-Hong Kong-Guangzhouˇ± innovation trade. Local governments have introduced
cluster rose to the top of the global innovation stronger policies to unlock domestic demand
index in 2025 . and offset growing external uncertainties. The
4
nine Guangdong cities of the GBA reported
In H1 2025, the regionˇŻs economy showed a combined RMB4.38 trillion (US$610 billion)
resilient and dynamic growth, supported by the in foreign trade, growing 4.3% year-on-year
4 WIPO, https://www.wipo.int/en/web/global-innova- (YoY). Imports of computers and components,
tion-index/2025/innovation-clusters semiconductor manufacturing equipment and
70 71