Page 47 - 2024 Special Report on the State of Business in South China
P. 47
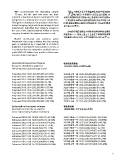
accommodate the fluctuating sample 为�???????�???��????对�??��????�?
sizes, for the past few years we have ?????���?��???�?100家�?�?��?��?�??
reported reinvestment figures normalized to 100 ?��?�????????�??�??�???��????�??�??�?
companies as a primary year on year comparison. �?�?��???�???��?以�?类�??��????访�?�?????
The figure is calculated as the products of the mean �??�????�?????�?���?��?��?�??2.5亿�???????
of each category range and the percentage of total ??�???2.5亿�?????
respondents indicating that category, except in
the case of the largest (US$250 million or more) �?????�???��?�??对�?�???��???��???�?
category, for which the minimum value is used. �?????�?年�????�??�?���???��??�润???�??
�???��?�??40.15%�?????�??计达109.5亿�?????
Market uncertainty and concerns about
investment risks may continue into the coming
year, as evidenced by a steep fall of 40.15% in
budgeted reinvestment from profits in China. It
is estimated that the companies studied have set
aside US$10.95 billion from profits in China over
the next three to five years.
Normalized reinvestment figures ??????�????
(Response distribution applied to �?��100家�?�?????�?��???�?
100 companies by percentage share)
2024年�??��?年�?US$ 1,838,500,000 (-40.15%)
Projected 2024: US$ 1,838,500,000 (-40.15%) 2023年�??��?年�?US$ 3,072,000,000 (-30.98%)
Projected 2023: US$ 3,072,000,000 (-30.98%) 2022年�??��?年�?US$ 4,451,000,000 (+45.2%)
Projected 2022: US$ 4,451,000,000 (+45.2%) 2021年�??��?年�?US$ 3,065,000,000 (-3.1%)
Projected 2021: US$ 3,065,000,000 (-3.1%) 2020年�??��?年�?US$ 3,163,800,000 (-2.7%)
Projected 2020: US$ 3,163,800,000 (-2.7%) 2019年�??��?年�?US$ 4,362,500,000 (+37.9%)
Projected 2019: US$ 4,362,500,000 (+37.9%) 2018年�??��?年�?US$ 3,163,800,000 (+11.8%)
Projected 2018: US$ 3,163,800,000 (+11.8%) 2017年�??��?年�?US$ 2,829,650,000 (-4.12%)
Projected 2017: US$ 2,829,650,000 (-4.12%) 2016年�??��?年�?US$ 3,296,485,000 (+8.79%)
Projected 2016: US$ 3,296,485,000 (+8.79%) 2015年�??��?年�?US$ 3,030,100,000 (-9.30%)
Projected 2015: US$ 3,030,100,000 (-9.30%) 2014年�??��?年�?US$ 3,343,500,000 (+30.10%)
Projected 2014: US$ 3,343,500,000 (+30.10%)
�?��???�?
Estimated reinvestment volumes �?????�?���?���??�??为系?��?
(Normalized, scaled by an adjusted
factor representing chamber members) 2024年�??��?年�?US$ 10,953,120,817 (-40.15%)
2023年�??��?年�?US$ 18,301,869,541 (-30.98%)
Estimated 2024: US$ 10,953,120,817 (-40.15%) 2022年�??��?年�?US$ 26,517,454,859 (+45.2%)
Estimated 2023: US$ 18,301,869,541 (-30.98%) 2021年�??��?年�?US$ 18,260,166,062 (-3.1%)
Estimated 2022: US$ 26,517,454,859 (+45.2%) 2020年�??��?年�?US$ 18,848,780,877 (-2.7%)
Estimated 2021: US$ 18,260,166,062 (-3.1%) 2019年�??��?年�?US$ 19,377,342,953 (+37.9%)
Estimated 2020: US$ 18,848,780,877 (-2.7%) 2018年�??��?年�?US$ 14,052,959,916 (+11.8%)
Estimated 2019: US$ 19,377,342,953 (+37.9%) 2017年�??��?年�?US$ 12,568,733,177 (-4.12%)
Estimated 2018: US$ 14,052,959,916 (+11.8%) 2016年�??��?年�?US$ 13,087,053,000 (+8.79%)
Estimated 2017: US$ 12,568,733,177 (-4.12%) 2015年�??��?年�?US$ 12,029,504,000 (-9.30%)
Estimated 2016: US$ 13,087,053,000 (+8.79%) 2014年�??��?年�?US$ 13,273,703,000 (+30.10%)
Estimated 2015: US$ 12,029,504,000 (-9.30%)
Estimated 2014: US$ 13,273,703,000 (+30.10%)
47