
Page 31 - AmCham South China 2026 Special Report on the State of Business in South China
P. 31
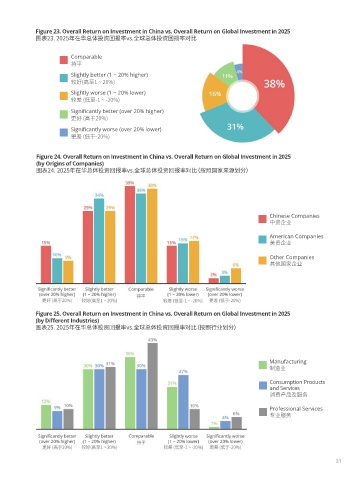
Figure 23. Overall Return on Investment in China vs. Overall Return on Global Investment in 2025
暠깊23. 2025쾨瞳빽悧竟尻栗쀼괩쪽vs.홍헷悧竟尻栗쀼괩쪽뚤궐
Comparable
넣틱
Slightly better (1 ~ 20% higher)
싹봤(멕逞1 ~ 20%)
Slightly worse (1 ~ 20% lower)
싹뀌 (됴逞-1 ~ -20%)
Significantly better (over 20% higher)
뫘봤 (멕黨20%)
Significantly worse (over 20% lower)
뫘뀌 (됴黨-20%)
Figure 24. Overall Return on Investment in China vs. Overall Return on Global Investment in 2025
(by Origins of Companies)
暠깊24. 2025쾨瞳빽悧竟尻栗쀼괩쪽vs.홍헷悧竟尻栗쀼괩쪽뚤궐(객亮벌소윱都뺍롸)
Chinese Companies
櫓栗폐撚
American Companies
쳄栗폐撚
Other Companies
페儉벌소폐撚
Figure 25. Overall Return on Investment in China vs. Overall Return on Global Investment in 2025
(by Different Industries)
暠깊25. 2025쾨瞳빽悧竟尻栗쀼괩쪽vs.홍헷悧竟尻栗쀼괩쪽뚤궐(객亮契撚뺍롸)
Manufacturing
齡芚撚
Consumption Products
and Services
Break even 句롤끓틔섟륩蛟
Professional Services
淚撚륩蛟
30 31