Page 396 - 2017 White Paper
P. 396
2017 White Paper on the Business Environment in China
Annual Revenue in China in 2016 (III) Primary & 14.5% 15.5% 18.5% 11.5%
Secondary
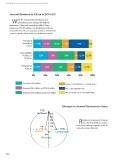
While the respondents of primary and
secondary sectors realized the highest Sector
revenues in China with more than 30% of those
being over US$250 million, the breakdown of those Consumption 25% 15% Prim3a0ry%&
respondents in the consumption products and services Products & Secondary
as well as professional services is distributed evenly. Services
Sector
Primary & Professional 12.5% 21% 24% 12.5
Secondary Services 20% Consumption
Sector 14.5% 15.5% 18.5% 11.5% 34% 6% Products &
40% Servic6e0s%
0%
Consumption 30% 5% 12.5% 12.5% ProfSeessrivoicnBeaesl tw1
Products & 25% 15% Mo0r%e
6% Services Not a
% Less t
PrBoefSetwessreiveoincneUaslS$5102m.5il%lion and 21% million 24% 12.5% 11.5% 18.5% Betw
100% 60% 80% 100% Betw
US$250
More than U0S%$250 million20% 40%
Not applicable (eg. representation o ce)
Less than US$1 million
Between US$1 million and US$10 million
Between US$10 million and US$50 million
Changes in Annual Revenue in China
55%
Increase 50%
40% Referring to changes of revenue
from 2015 to 2016, more than
30% half of respondents reported a rise in
annual revenues this year.
20%
11% 10% 25%
Not Comparable
applicable
9%
Decrease
396
Annual Revenue in China in 2016 (III) Primary & 14.5% 15.5% 18.5% 11.5%
Secondary
While the respondents of primary and
secondary sectors realized the highest Sector
revenues in China with more than 30% of those
being over US$250 million, the breakdown of those Consumption 25% 15% Prim3a0ry%&
respondents in the consumption products and services Products & Secondary
as well as professional services is distributed evenly. Services
Sector
Primary & Professional 12.5% 21% 24% 12.5
Secondary Services 20% Consumption
Sector 14.5% 15.5% 18.5% 11.5% 34% 6% Products &
40% Servic6e0s%
0%
Consumption 30% 5% 12.5% 12.5% ProfSeessrivoicnBeaesl tw1
Products & 25% 15% Mo0r%e
6% Services Not a
% Less t
PrBoefSetwessreiveoincneUaslS$5102m.5il%lion and 21% million 24% 12.5% 11.5% 18.5% Betw
100% 60% 80% 100% Betw
US$250
More than U0S%$250 million20% 40%
Not applicable (eg. representation o ce)
Less than US$1 million
Between US$1 million and US$10 million
Between US$10 million and US$50 million
Changes in Annual Revenue in China
55%
Increase 50%
40% Referring to changes of revenue
from 2015 to 2016, more than
30% half of respondents reported a rise in
annual revenues this year.
20%
11% 10% 25%
Not Comparable
applicable
9%
Decrease
396