Page 392 - 2017 White Paper
P. 392
7 White Paper on the Business Environment in China
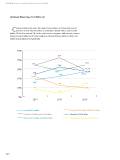
Annual Revenue in China (I)
Compared with prior years, the share of respondents in China with annual 30%
revenues of over US$250 million and between US$50 million and US$250 25%
million 2016 fell by around 2%. On the other hand, companies with annual revenues
between US$10 million and US$50 million in China and those with less than US$1
million increased by 3% respectively .
30% 22% 26% 22% 20% 22%
25% 15%
20% 17% 21% 19.7% 10% 17%
15% 16% 19% 18.8% 16%
10% 18.3% 5%
14% 16% 14%
9% 11.2% 9%
11% 10%
7% Between
22% 5% Between US$50 million and US$250 million 2015 2016 2014
19.7%
22% More than US2$205104million More th
18.83%0% Not app
17% 26%
18.3% 16% Less tha
Not applicable (eg. representative o ce ) Between
25% 14% Between
9%
11.2% 22%
10%20% Less than US$1 m21il%lion 19.7% Between US$50 million and US$250 million
More than US$250 million
2016 15% Between US$119m%il1l6io%n and US$10 millio1n8.3%18.8% Not applicable (eg. representative o ce )
10% Between US$10 million and US$50 million Less than US$1 million
Between US$1 million and US$10 million
5% 11% 11.2% Between US$10 million and US$50 million
10%
7%
2014 2015 2016
392