Page 397 - 2017 White Paper
P. 397
Consumption 25% 15% 30% The American Chamber of Commerce in South China
Products &
Services Betwe
5% 12.5% 12.5%
More t
34% 6% Professional 12.5% 21% 2016ๅนดๅ???นดๅบ??ปๆ??ฅ๏?III๏ผ? Not ap
Services Less th
ไป?24% 12.5%่ก??11็ป?.5%?????1๏ผ?8.5ไป?%ไบ??ไธ????ไบ?บงไธ????
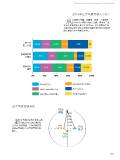
่ฎฟไ?ไธ?2016ๅนดๅ?????ฅๆ?้ซ???ถไธญ็บ????
Betw2e0e%n US$50 mil4li0o%n and US$???25่ฎฟๆ?600?กไ?m%i???llio??นดn ่ฎฟๅบฆ?ถไ?ไธ??80ไปฅ่?%่ฟ??2??.5ไป?บฟไธ??1ไธ?0??0??%๏ผ??ไป??ไบ??ๆถ??่ดนไ????ไบงๅ????
5% 12.5% 12.5% 0% Betwe
14.5% 15.5% 18.5% 34M%ore than U6S%$250 million ??นดๅบ???ฅๆฐดๅนณๅ?่พ?ธบๅนณๅ??? Betwe
11.5%
5% 11.5% 18.5% Not applicable (eg. representation o ce)
25% 15%
Less than US$1 million Between US$50 million and US$250 million
30% 5% 12.5% 12.5%
80% 100% Between US$1 million and US$10 million More than US$250 million
Between US$10 million an5d5U%S$50 millionNot applicable (eg. representation o ce)
w1e2e.5n%US$502m1%illion and U2S4$%250 mil1li2o.5n% 11.5% 18.5% Increase 50%
40%Less than US$1 million
%e than US$220%50 million40% 60% 80% 100%
30%Between US$1 million and US$10 million
applicable (eg. representation o ce) 11% 20%
than US$1 million Not 10%Between US$10 million and US$50 million
applicable
25%
Comparable
9%
ween US$1 million and US$10 million Decrease
ween US$10 million and US$50 million
?จๅ?ๅนดๅบฆ?ฅๆ????
่ถ????????่ฎฟไ?ไธ?กจ็คบไ?
ไป??2016ๅนด็??ฅๆ?ๅฏนๆ?
2015ๅนดๆ???ๅข??๏ผ??????ฐๅ?่ฎ?
ไผ??่กจ็คบไป?ปฌ2016ๅนด็??ฅๆ????
?????
397
Products &
Services Betwe
5% 12.5% 12.5%
More t
34% 6% Professional 12.5% 21% 2016ๅนดๅ???นดๅบ??ปๆ??ฅ๏?III๏ผ? Not ap
Services Less th
ไป?24% 12.5%่ก??11็ป?.5%?????1๏ผ?8.5ไป?%ไบ??ไธ????ไบ?บงไธ????
่ฎฟไ?ไธ?2016ๅนดๅ?????ฅๆ?้ซ???ถไธญ็บ????
Betw2e0e%n US$50 mil4li0o%n and US$???25่ฎฟๆ?600?กไ?m%i???llio??นดn ่ฎฟๅบฆ?ถไ?ไธ??80ไปฅ่?%่ฟ??2??.5ไป?บฟไธ??1ไธ?0??0??%๏ผ??ไป??ไบ??ๆถ??่ดนไ????ไบงๅ????
5% 12.5% 12.5% 0% Betwe
14.5% 15.5% 18.5% 34M%ore than U6S%$250 million ??นดๅบ???ฅๆฐดๅนณๅ?่พ?ธบๅนณๅ??? Betwe
11.5%
5% 11.5% 18.5% Not applicable (eg. representation o ce)
25% 15%
Less than US$1 million Between US$50 million and US$250 million
30% 5% 12.5% 12.5%
80% 100% Between US$1 million and US$10 million More than US$250 million
Between US$10 million an5d5U%S$50 millionNot applicable (eg. representation o ce)
w1e2e.5n%US$502m1%illion and U2S4$%250 mil1li2o.5n% 11.5% 18.5% Increase 50%
40%Less than US$1 million
%e than US$220%50 million40% 60% 80% 100%
30%Between US$1 million and US$10 million
applicable (eg. representation o ce) 11% 20%
than US$1 million Not 10%Between US$10 million and US$50 million
applicable
25%
Comparable
9%
ween US$1 million and US$10 million Decrease
ween US$10 million and US$50 million
?จๅ?ๅนดๅบฆ?ฅๆ????
่ถ????????่ฎฟไ?ไธ?กจ็คบไ?
ไป??2016ๅนด็??ฅๆ?ๅฏนๆ?
2015ๅนดๆ???ๅข??๏ผ??????ฐๅ?่ฎ?
ไผ??่กจ็คบไป?ปฌ2016ๅนด็??ฅๆ????
?????
397