Page 389 - 2017 White Paper
P. 389
6 17% 15.2% 11.1% 14.3% 21.4T%he American C2h1am%ber of Commerce in South China
2016 17% 15.2% 11.1% 14.3% 21.4% 21%
????ฐ้?
20125 01521% 15% 10% 13% 21% 20% 20%
21% 15% 21001%7 13% 21%
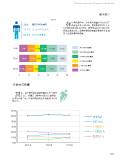
2014 13% ?จไ?ๅนด็?่ฐ??ไธ??ไผ??????ฐ้???250ไบบไปฅไธ?
???่ฎฟไ?ไธ??42.5%๏ผ????????251ไบบ่?
17% 10% 16% 23% 201621% 1000???่ฎฟไ?ไธ??25.5%๏ผ????????่ฟ?110070%ไบบ็? 15.2%
???ไผ????32%???่กจๆ???ปฌ????ฅ่?ไฝ??ไธ??ไผ??
20140 2103% 4017% 6010% 8016% ??1ๅค?00ไผ??2??3%?ฐ็?????นใ??21%
60% 2016 17% 15.2% 11.1% 14.3% 21.4% 21%
20115L0e0ss 21% 15%
50% 0 20 40 60 80 than 5
32% More than 1000 employees
40%
25.5% Between 251 & 1000 employees Between 6 and 10
201530% 42.5% Less th2a1n 2%50 employees15% 10% 13% 212%014BBeettwwee1ee3nn%221011%aanndd1725%00
20% seeyolpme 0001 naht eroM %23 More than 51
10% %5.52 0 20
seeyolpme 0001 & 152 neewteB
0% 23% 21%
20140 seeyo2lp02m01e405123na%40ht sseL 162%00751%.524 8010% 100210166%
ๅค??????ฐ้? 0 20 40 60 80 100
?ถไธญ๏ผ????????ไผ?????็ฑ??ๅทฅๅ?ไบ??็ญ? 60 80 100
ไบ?5ไบบ๏?ๅค????ทฅ?ฐ้???6??50ไบบ็????
ไผ??็บ??่ฟ????????็บ?ธค???ไผ?????่ฟ?50???
็ฑ??ๅทฅใ??
0 20 40
0 20
389
0 20 40 60 80 100
2016 17% 15.2% 11.1% 14.3% 21.4% 21%
????ฐ้?
20125 01521% 15% 10% 13% 21% 20% 20%
21% 15% 21001%7 13% 21%
2014 13% ?จไ?ๅนด็?่ฐ??ไธ??ไผ??????ฐ้???250ไบบไปฅไธ?
???่ฎฟไ?ไธ??42.5%๏ผ????????251ไบบ่?
17% 10% 16% 23% 201621% 1000???่ฎฟไ?ไธ??25.5%๏ผ????????่ฟ?110070%ไบบ็? 15.2%
???ไผ????32%???่กจๆ???ปฌ????ฅ่?ไฝ??ไธ??ไผ??
20140 2103% 4017% 6010% 8016% ??1ๅค?00ไผ??2??3%?ฐ็?????นใ??21%
60% 2016 17% 15.2% 11.1% 14.3% 21.4% 21%
20115L0e0ss 21% 15%
50% 0 20 40 60 80 than 5
32% More than 1000 employees
40%
25.5% Between 251 & 1000 employees Between 6 and 10
201530% 42.5% Less th2a1n 2%50 employees15% 10% 13% 212%014BBeettwwee1ee3nn%221011%aanndd1725%00
20% seeyolpme 0001 naht eroM %23 More than 51
10% %5.52 0 20
seeyolpme 0001 & 152 neewteB
0% 23% 21%
20140 seeyo2lp02m01e405123na%40ht sseL 162%00751%.524 8010% 100210166%
ๅค??????ฐ้? 0 20 40 60 80 100
?ถไธญ๏ผ????????ไผ?????็ฑ??ๅทฅๅ?ไบ??็ญ? 60 80 100
ไบ?5ไบบ๏?ๅค????ทฅ?ฐ้???6??50ไบบ็????
ไผ??็บ??่ฟ????????็บ?ธค???ไผ?????่ฟ?50???
็ฑ??ๅทฅใ??
0 20 40
0 20
389
0 20 40 60 80 100