Page 390 - 2017 White Paper
P. 390
7 White Paper on the Busi6n0ess Environment in China
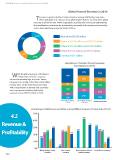
40 Global Annual Revenue in 2016
20
There was a general decline of annual revenue among participating companies,
0 either worldwide or in China, in 2016, which implies that the recovery of the global
economy is still on the way. While respondents in professional services earned relatively
32%
high worldwide annual revenues, participating companies in the primary and secondary
12% sectors generated large annual turno3v2%ers in Ch1i8n%a. More than US$250 million
Between US$50 million and US$250 million
17% Between US$10 million and US$50 million
18% Mor1e2%than US$250 millionBetween US$1 million and US$10 million
21% Less than US$1 million
Between US$50 million and US$250 million
17% Between US$10 million and US$50 million
Between US$1 million and US$10 million
21% Less than US$1 million
Breakdown of Global Annual Revenue
by Industries (2016)
While the global revenues of AmCham?? 100 23% 29%
wholly foreign-owned companies
still remain relatively high, the local Chinese 80 46% 20% 13%
companies are usually of less than US$50 million
revenue 2016. On the other hand, more than 60 20% 23%
40% of respondents in primary and secondary
sectors generated relatively high global 9% 14% 21%
revenues of over US$250 million in 2016. 40 23%
20 10%
23% 14%
12%
Consumption Products Professional Services
0 Primary & Secondary & Services
Sectors
Breakdown of Global Annual Revenue by Different Types of Companies (2016)
4.2100 50% 2429% %
23% 100 33%
Rev80enue &46% 40%
80 25% 13%
30% 20%29% 30% 31%
25% 24%
Pro6f0itability 20% 60
24% 24% 23% 20%
21%
40
15% 20%11% 20 23% 14%
6%
9% 10%
40 3% 0
390
23% 14%0% Joint venture Representative o ce of Local Chinese company
20 10% Wholly foreign-owned company
company 21%foreign company