
Page 24 - AmCham South China 2026 Special Report on the State of Business in South China
P. 24
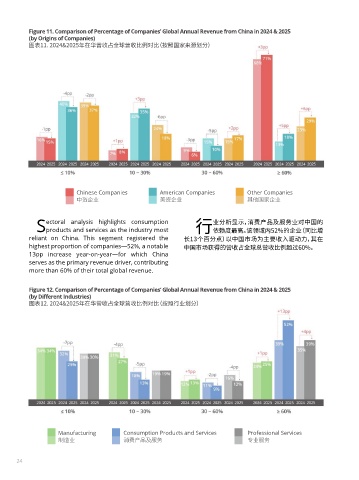
Figure 11. Comparison of Percentage of Companies’ Global Annual Revenue from China in 2024 & 2025
           (by Origins of Companies)
           图表11. 2024&2025年在华营收占全球营收比例对比(按照国家来源划分)


                          Chinese Companies           American Companies           Other Companies
                          中资企业                        美资企业                         其他国家企业


                ectoral analysis highlights consumption                 业分析显示,消费产品及服务业对中国的
             Sproducts and services as the industry most          行依赖度最高。该领域内52%的企业(同比增
           reliant on  China.  This  segment  registered the   长13个百分点)以中国市场为主要收入驱动力,其在
           highest proportion of companies?52%, a notable     中国市场获得的营收占全球总营收比例超过60%。
           13pp  increase year-on-year?for which  China
           serves as the primary revenue driver, contributing
           more than 60% of their total global revenue.


           Figure 12. Comparison of Percentage of Companies’ Global Annual Revenue from China in 2024 & 2025
           (by Different Industries)
           图表12. 2024&2025年在华营收占全球营收比例对比(按照行业划分)


                    Manufacturing         Consumption Products and Services        Professional Services
                    制造业                   消费产品及服务                                  专业服务

       24                                                                                                                                                                                                                              25